Understanding Candlestick Patterns: A Beginner’s Guide
If you’re new to the world of investing and want to learn about analyzing stock prices, one of the essential tools to grasp is the “candlestick chart.” Don’t be intimidated by the name – candlestick patterns are simple to understand, and they provide valuable insights into how stock prices are moving.
What’s a Candlestick Patterns?
Imagine a candlestick as a visual representation of what happens with a stock’s price during a specific time period. Each candlestick on the chart tells a little story about how prices changed within that time frame.
Here’s how it works:
The Candlestick Body:
Think of this as the main part of the candlestick, like the candle’s body. It shows you the range between where the stock’s price started (the opening price) and where it finished (the closing price) during that time frame.
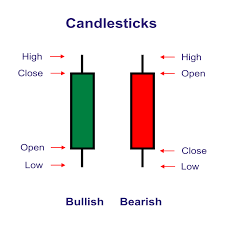
- If the closing price is higher than the opening price, the body is usually filled or white, suggesting that it’s been a good period for the stock (a bullish sign).
- If the closing price is lower than the opening price, the body is shaded or black, indicating a less positive time for the stock (a bearish sign).
The Candlestick Wick:
Imagine the wick as the thin parts that stick out above and below the body. These represent the high and low points the stock reached during that time frame.
- The upper wick shows the highest price reached during that period.
- The lower wick reveals the lowest price during the same time.
What Can You Learn from Candlestick Charts?
Candlestick charts help investors and traders understand how stock prices are moving. They are like a visual language that tells you whether buyers or sellers are in control.
For example:
- If you see a candlestick with a small body and a long tail sticking down, it might be signaling that the stock’s price went down during that time but then bounced back up – a potential sign of a bullish reversal.
- On the other hand, a candlestick with a small body and a long tail sticking up might suggest that the stock’s price went up and then quickly dropped back down, potentially indicating a bearish reversal.
Common Candlestick Patterns:
In addition to single candlesticks, you’ll find patterns made up of multiple candlesticks, such as “doji” (when the opening and closing prices are nearly the same) or “engulfing” patterns (where one candlestick engulfs the previous one). These patterns can give you more hints about what’s happening in the market.
Using Candlestick Charts:
Candlestick charts are handy tools to make informed investment decisions. You can spot trends, potential reversals, and key price levels, which are essential for traders and investors. They can help you set the right time to buy or sell a stock.
So, don’t be intimidated by candlestick charts. They’re a simple and valuable way to understand how stock prices move, and once you get the hang of them, you’ll be able to make more informed decisions in the exciting world of investing.
Add a Comment